The VFBV Volunteer Welfare and Efficiency Survey was from the outset, designed and detailed by CFA volunteers.
In 2012, with the assistance of a professional survey development consultancy, VFBV workshopped with volunteers from across Victoria, to identify key issues considered to be the key factors underpinning their welfare and efficiency. Key recurring themes emerging from the workshop with this group were then used to construct the survey.
The survey consists of 33 statements addressing the welfare and efficiency of CFA volunteers. Survey respondents are asked to score each statement twice: firstly on how important it is for the statement to be true and secondly, how they perceive performance against that statement. Scores are applied to a 0 – 10 sliding scale where for importance, 0 is ‘not at all important’ and 10 is ‘very important – and in the case of performance, 0 is ‘strongly disagree’ and 10 is ‘strongly agree’.
Scores for importance are regarded as the expectations of CFA volunteers. Where scores for performance are lower than those for importance, the result suggests that expectations are not being met. The difference between importance and performance in the survey results for each question is referred to as the gap.
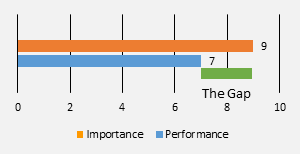
The chart below indicates a typical survey response against a given statement, where the total number of responses to the statement produce an average gap between importance and performance (in this case ‘2’).

The 33 survey statements are grouped into seven themes for analysis of the results. Statements are randomly listed in the survey to avoid leading the results. The results are then re grouped under seven themes for analysis purposes.
The seven survey analysis themes are:
- Respect and professionalism
- My role as a volunteer
- Cooperation
- Support from CFA
- Training by CFA
- Recruitment and retention
- People management – my brigade
The survey design allows each theme to be explored for variations between respondents, including brigade service/risk environment (rural, urban or integrated), gender, volunteer age and length of service.
The results can also be analysed from Region to Region, with CFA’s Regional structure allowing for the identification of examples of good practice or conversely, areas where a lacking performance needs most attention.
Whilst the survey collects quantitative data that is easily expressed in results that measure importance, performance and gap, the survey also provides the respondent the opportunity to reply to any of the statements with their own thoughts and opinions.
In this way the survey also collects some qualitative data than can be used to gain insight into what sits behind the numerical results.
With survey results from the past three years, VFBV is now able to observe trends over time.
Recently, further work has also been undertaken with the assistance of university researchers with expertise in quantitative survey analysis to drill down into the survey results and explore specific demographic trends or patterns that emerge.
 About
About 